
Due to the rapid work at a call or contact centre, it is easy to lose track of your team’s performance. Not tracking your team’s performance can affect their productivity.
The only way to keep track of your team is to consciously measure their performance.
But how do you measure your team’s performance?
In this article, you’ll discover 15 call centre KPIs and metrics you must track.
How did we come up with this list? We scraped the ideas of call centre experts on the internet and compiled 15 of the top metrics they recommended.
Let’s dive right in.
What is KPI in a call centre?
Key Performance Indicators(KPIs) are business or call centre metrics used to measure performance.
It’ll help boost customer satisfaction and agent performance because you’ll know what’s working for your business and stick to it.
You’ll also learn how to focus on improving lagging areas.
So, what call centre metrics should you track?
The list is long, and they’re all interwoven.
With our experts’ help, we’ve compiled the 15 primary call centre metrics and KPIs you MUST track.
We’ve split them into two:
- Call centre metrics and KPIs to track customer experience (CX)
- Call centre metrics and KPIs to track team performance.
Customer experience call centre metrics and KPIs to track
Our experts have picked the best KPIs and call centre metrics for your customers’ experience. Let’s go over them one after the other.
1. First Call Resolution rate (FCR)
FCR is the KING of all call centre metrics because it is a leading forecaster of business outcomes due to its CX.
“For example, customers who experience first call resolutions are more likely to feel more satisfaction from their conversation with your agents, continue to do business, and recommend you to others.” – SQM Customer Service QA Experts.
First Call Resolutions is also known as one-touch.
It’s a call centre metric that measures the rate of queries your agents resolve on the first interaction.
Naturally, a reasonable FCR rate means more satisfied customers.
An alarming FCR rate is a two-edged sword – it increases business costs and reduces customer satisfaction.
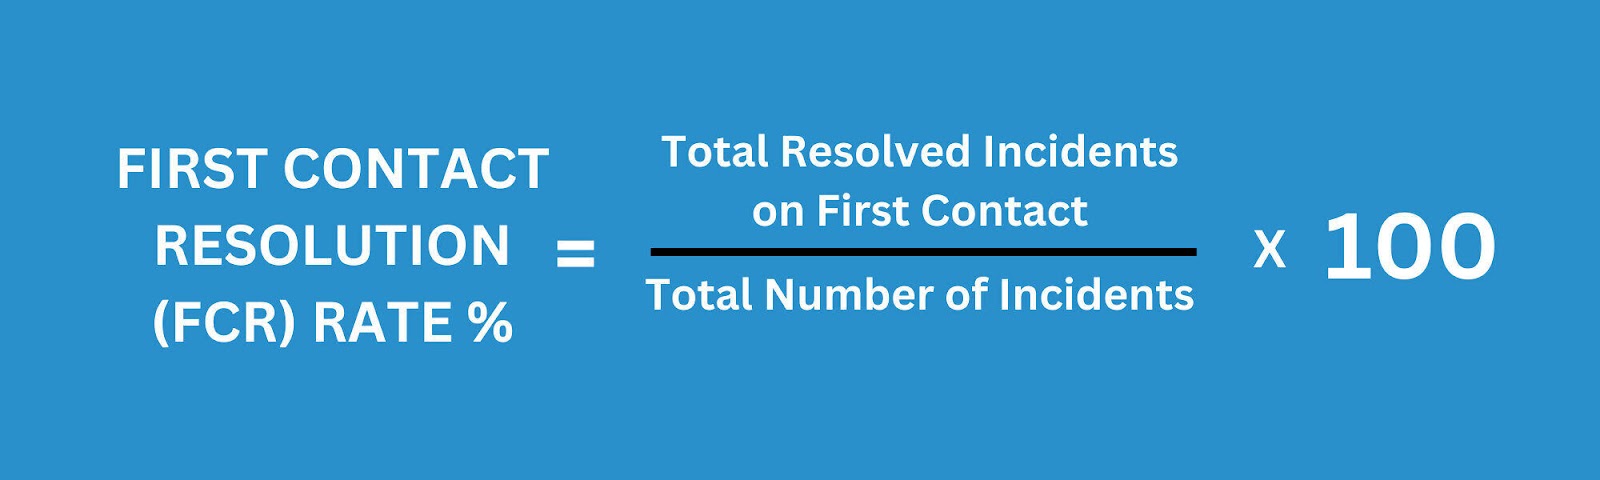
Here’s how to calculate FCR.
Divide the cases resolved the first time by the total number of cases. Then multiply the result by 100.
The formula for fcr% = (resolved incidents on first contact ÷ total number of incidents) × 100
What’s the industry standard for an effective FCR? It varies.
You’d often hear that the standard rate is between 70% and 75%.
Although this could be true for different businesses, it depends on how each organisation measures their rates.
Factors such as technology, people, and processes make determining the general standard FCR rate difficult.
However, strive to maintain a rate of at least 70% to 75%.
How? Employ the services of the best call centre solutions providers.
With the best call centre solutions provider, like TelebuHub, you’ll have access to the following:
- Role-based dashboards where every agent has access to the caller’s data before picking up the call
- Advanced IVR menus,
- Integrated social media applications.
- Staff trained on active listening.
2. Customer Satisfaction Score (CSAT)
“A high CSAT score of a business (or staff member) will likely indicate a client’s willingness to endorse your business to their network and will reflect their loyalty.” – Dominic Meulemans, COO & Co-founder at RateMyService.io.
The CSAT call centre metric measures the percentage of satisfied customers with your services.
We call it the happy customer score.
Get this feedback by asking your customers simple questions like the one in the image below.

After receiving this feedback, how do you measure your CSAT score?
It’s simple.
Take the total number of satisfied customers (those who you rated 4 or 5), then divide it by the total number of responses.
The formula for csat% = (satisfied customers ÷ the total number of responses) × 100.
The industry standard CSAT score is 75 to 84%.
So, how do you keep such a reasonable rate?
Here are some expert tips:
- Automate the CSAT score after every customer service interaction.
- Send the survey while the interaction is still fresh.
- Be creative. Make your CSAT survey visual by inputting engaging elements like stars, buttons, and images.
- Personalise your CSAT survey emails. Use customers’ first names in your survey emails.
- Offer incentives for their feedback, such as discounts and promo codes.
3. Customer Effort Score (CES)

“All customer feedback questions should aim for simplicity… Straightforward questions tend to have a higher response rate as they simply feel easy to follow.” – Moritz Dausinger, CEO of Refiner.
The CES metric is a feedback survey used to measure how seamlessly your customer found the interaction with your business or service.
So, the more effort the customer exerts, the greater the discomfort. Automatically, that means the lower the rate, the better.
Now, how do you measure your CES rate?
Moritz asks the customer a simple question using a scale of 1 to 5 (or 7).
To illustrate: “On a scale of 1 to 7, how easy was it to interact with our team?”
The more straightforward and creative your CES questions are, the easier it is to convince your customers to complete the survey.

Source: refiner.io
To calculate your CES rate, divide the customer-given scores by the sum of the scores presented, then multiply the result by 100.
For example, you presented 10 customers with a 1 – 7 numerical scale. 8 customers gave you 5/7, while the remaining 2 customers gave you 6/7.
The total of scores given will be 40 + 12 = 52.
Since sum total of scores presented is 7 × 10 = 70, then the CES rate will be:
(52 ÷ 70) × 100 = 74%.
The formula for CES% = (total of customer-given scores ÷ sum of scores presented) × 100.
A reasonable CES rate is 70% and above. Anything less than this isn’t good for your business and needs to be worked upon.
Target 90% or higher. Most of the time, it’s a sign of loyal customers. You need a more creative way to quickly get this feedback from your customers.
To do this, Moritz advises you to follow these tips:
- Keep it simple
- Be clear and straight to the point
- Avoid using the word “effort.”
- Use numerical scales
- Likert Scales,
- Add emoticons.

Source:dlpng.com
4. Average churn rate

In the words of Jason M. Lemkin, CEO and Co-founder at Saastr:
“Lowering churn from 2% a month to 1.5% ensures everyone has a direct financial metric to be responsible for.”
The Churn rate is also called the abandonment rate.
It’s a call centre metric that shows the percentage of customers that leave a call before the contact agent reaches their goal.
A high churn rate signals poor customer service. So, you must endeavour to keep your rates low.
To calculate your abandonment rate, divide abandoned calls by the number of calls received.
The formula = (number of abandoned calls ÷ total number of calls received) × 100.
The average churn rate for call centres is between 30% and 45%. Unfortunately, many call centres experience very high churn rates.
Here are 4 super effective ways to drive your churn rates down:
- Actively engage your customers through your website, email campaigns, and social media.
- Conduct surveys to know why they abandon calls and work on their responses.
- Encourage free trials, then request feedback using
- Make the unsubscribe process fluid and easy for customers.
5. Net Promoter Score (NPS)

“While many call centre metrics allow you to fixate on certain numbers, NPS is best viewed as an indicator of change. It allows you to gauge the changing direction of your customer satisfaction and loyalty.” – Simon James.
NPS is the call centre metric that shows your customers’ loyalty to your business.
A loyal customer will more likely endorse your services.
How do you calculate your NPS rate? First, send a simple survey question like this:
“From 1 to 10, 1 being unlikely and 10 being most likely, would you endorse this business to a friend?”
Next, segment their responses into three:
- Promoters – those who select 9 or 10
- Passive – those who select 7 or 8
- Detractors – those who select 6 or below.
Then, subtract the number of promoters from the total number of detractors.
So, the NPS formula should look like this:
[(Number of promoters ÷ number of respondents) × 100 – (number of detractors ÷ number of respondents) × 100]
Remember that a reasonable NPS rate for call centres is 50% and above.
So here are tips to improve your NPS rates:
- Track your NPS rate and act on it immediately
- Invest in the best customer service teams and continue training them
- Personalise your email survey invites
- Make your surveys user-friendly
- Engage your customers, especially the detractors
- Keep your promoters happy through discounts or limited-edition products
- Give your customer service agents some autonomy.
6. Cost Per Call (CPC)
“In any customer service organisation, cost, or unit cost, is critically important.”
“Cost per contact measures how efficiently a contact centre conducts its business.” – Jeff Rumburg, Managing Partner & Co-founder of MetricNet LLC.
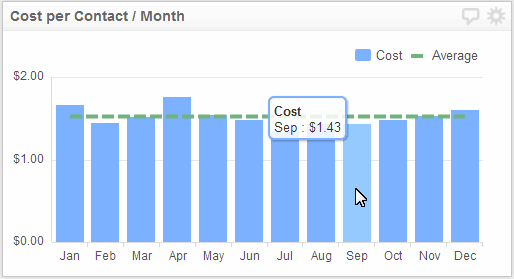
The Cost Per Call KPI measures the money or resources required to handle a single inbound or outbound call. It measures your ROI.
To calculate this call centre metric, divide your total costs per period by the amount of calls answered.
The cost per call rate formula = (total expenses ÷ total calls answered) × 100.
Automatically, this means that the lower your costs per call rate, the better.
The industry standard for Cost Per Call depends on your business. However, lowering your costs per call should not affect your CSAT rates.
These are ways you can lower your Costs Per Call rates:
- Hire the services of the best pay-as-you-use cloud-based call centre to eliminate the cost of maintenance and long-term subscription renewals.
- Account for every cost your business incurs accurately, including the total cost for each position in your call centre.
- Consider training your staff qualitatively only monthly, quarterly, or annually.
7. Call Completion Rate
“A low call completion rate significantly decreases customer satisfaction levels. It causes many related negative impacts, such as a certain amount of chaos,…[and] increases the burden of customer equipment.”
“…Customer service departments should always keep a lookout on improving this KPI.” – Andrei Costea.
The call completion rate is a call centre metric that measures the rate at which inbound and outbound calls are successfully initiated, handled, and completed.
Divide the total number of completed calls by the number of call attempts.
The formula for call completion rate = (total completed calls ÷ total call attempts) × 100.
The standard rate imposed by POTRAZ is 65%. However, customers expect a completion rate as high as 99% during peak hours.
How can you meet up with these rates? Here are some tips:
- Call agents MUST be well-trained in active listening.
- Follow the 80/20 rule.
- Focus on improving your First Call Resolutions.
8. Average Retention Rate
“Getting a new client costs five times more than retaining an existing one.” – Mike Desmarais, founder & CEO of SQM Group.
The Average Retention Rate metric helps you measure customers’ likelihood of using your product or service after the initial purchase.
This call centre metric is calculated by subtracting the number of customers acquired during a period from those obtained at the end.
Then, divide the difference by the number of customers acquired at the beginning of that period.
To get the percentage, multiply your answer by 100.
The formula for average retention rate = end of period – during period ÷ beginning of period × 100.
The average customer retention rate ranges by industry. However, the average general rate is between 70% to 80%. The higher the rate, the better.
So here’s how you can boost your customer retention rates:
- Send a discount after the initial purchase.
- Offer loyalty programs.
- After the first purchase, request timely NPS feedback
- Send engaging and personalised emails
- Improve your agents’ customer service skills
9. Average Speed of Answer (ASA)
“ASA…indicates how responsive a service desk is to incoming calls.”
“There is a common assumption in service and support that faster (slower) ASAs are better. On the contrary…, low ASAs don’t drive customer satisfaction.” – Jeff Rumburg, Co-founder of MetricNet LLC.
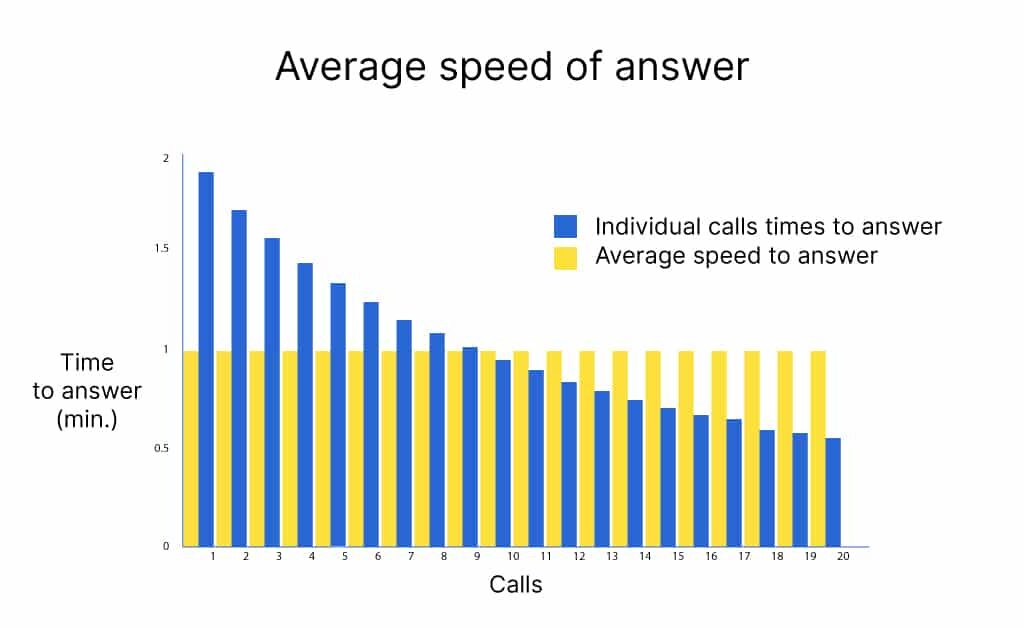
ASAs are metrics call centres used to measure agent response speed starting when the agent’s phone starts ringing.
This excludes IVR menu time and call routing time as well.
You calculate it by dividing the wait time for answered calls by the number of answered calls.
Here’s the formula: total waiting time ÷ the total number of answered calls.
Easy right? So, your target is low ASAs.
Low ASAs mean your agents are responding fast and efficiently. However, low ASAs come with extra costs for your business.
For instance, it might mean that you’re overstaffed. Increasing staff to reduce ASA will take a toll on your CPC.
At the same time, it will not boost your customer satisfaction, which should be your primary goal.
But don’t worry.
Jeff shares the “sweet spot” where your ASA can get optimised to reduce costs without sacrificing customer satisfaction.
That sweet spot appears when ASA is between 25% and 30% of the average handle Time. This is the recommended industry standard rate.
So, how do you keep such a reasonable standard rate?
Here’s how:
- Use TelebuHub’s workforce scheduling tool to eliminate costs while improving your analysis.
- Adhere to your workforce schedule.
- An all-hands-on-deck approach will help you during peak call and chat times.
- TelebuHub’s team will help you improve First Call Resolutions.
These will help you reduce costs and improve customer satisfaction while keeping your ASA rate within the standard.
10. Average Handle Time (AHT)
“By tracking AHT, you can notably decrease an agent’s time on a call.”
“Even the slightest decrease in AHT can help reduce your costs, reduce staffing needs and remarkably improve your company’s bottom line.” – Lauren Soucy, VP of Marketing for Time Doctor.
The Average Handle Time is a customer service metric showing the percentage of time spent on a single call, chat, or email between a contact agent and your customer.
This excludes pending time and time spent in the queue but includes talk, hold, and follow-up times like the NPS feedback.
AHT call centre metric is focused on reducing time spent resolving issues as opposed to the CSAT, which focuses primarily on satisfying the customer no matter the call or chat length.
And since both are relevant, you must strike a perfect balance.
Your AHT can be measured by dividing your total talk, hold, and follow-up time by the total number of calls or chats handled.
The formula for AHT = talk, hold, and follow-up time ÷ calls or chats handled.
The lower your AHT rates, the better.
Hence, the AHT call centre metric industry standard is slightly over 6 minutes.
To stay within this rate for the best customer service experience, you should:
- Provide steady agent training
- Conduct CES, NPS, and CSAT surveys after each conversation
- Route calls more effectively
- Choose the complete cloud-based call centre software.
This way, your AHT rates will stay in good shape and optimise customer satisfaction.
Team productivity call centre metrics and KPIs to track
Here are 5 vital human-centric KPIs to track and improve agent productivity.
1. Cost Per Acquisition (CPA)
“[It’s] a normalised KPI to understand the unit economics of how effective a company is at acquiring each of their customers.” – Michael Drew, New York Times Best Seller.
This KPI measures the success of various marketing campaigns such as emails, social media, SEO, and content marketing.
These are tools used to drive customer service.
This KPI can give you insights into your teams’ productivity when measured.
It is calculated by dividing the total customer acquisition-related expenses by the total number of customers in a given period.
The formula for CPA = total customer acquisition expenses ÷ total number of acquired customers per period.
The standard rate varies per business. However, a ratio of 1:3 is a good benchmark for your call centre metrics.
The lower the cost, the more your returns.
Here’s how you can improve this metric:
- Ensure your contact teams improve on their First Call Resolutions rates.
- Focus on bettering your Retention Rate.
- Align your ads to suit customer needs.
- Prioritise the right audiences.
- Track your campaigns.
2. Call Transfer Rate
“Develop a more sophisticated quality management program that uncovers the reasons for transfers and addresses them with targeted coaching.” – Charlie Mitchell, customer service specialist at CX Today.
A Call Transfer Rate KPI shows the percentage of calls transferred to the next agent.
To calculate the rate of transfer, divide the number of transferred calls by the total number of received calls and multiply the result by 100.
The formula for CTR% = (total transferred calls ÷ total calls received) × 100.
The industry standard rate is 10%.
Anything higher than that indicates a call resolution problem that needs to be fixed to boost revenue. Also, the average number of transferred calls per customer is just above 2.
That said, let’s talk about how to improve your CTRs:
- Work on your First Call Resolutions KPI.
- Train your team on problem-solving skills.
- Have calls monitored by team analysts for quality and reference purposes.
- Improve the general customer service skills of all your team members.
3. Service Level Scores (SLS)
“A good service level target must be accompanied by a service level interval score to measure not only your daily average but also show the continuity of your service.” – Edwin van der Hilst, Founder of Spril.
This KPI measures your business’s ability to meet up with agreements made with customers.
The formula for SLS = total calls answered under SLA threshold ÷ the total number of calls × 100. The industry standard rate is 86%.
Divide the number of calls answered under the service level threshold by the total number of calls, then multiply the result by 100.
Here’s how you can improve this call centre metric:
- Optimise the workforce process.
- Improve forecast accuracy.
- Study your charts and determine loopholes that need urgent attention.
4. Average After-call Work
“Spend less time on ACW (After Call Work). We want customers to see us taking action right away instead of waiting. This helps them trust us more, feel reassured, and want to tell others how great we are.” – Martyn Rushin, Care Centre Manager at Anglian Water.
This call centre metric measures the time call agents spend at the end of every call or chat with customers.
The formula for ACW = total number of seconds after call or chat ÷ total number of handled calls.
The industry standard rate is 6 minutes.
Divide the number of seconds the call agent spends after the conversation by the total number of handled calls.
Here’s how to improve this KPI:
- Call agents should inform customers during calls that they’ll be taking some notes during the call instead of afterwards.
- Implement performance goals to track improvement.
5. Call Volume Trend (CVT)

Source:researchgate.net
“High call volume and long wait times can be challenging for any call centre agent.
“To help you, always anticipate common questions, problems, or requests that customers may have. Then, prepare your responses accordingly.
“Planning can help you save time, avoid errors, and handle calls more confidently.” – Rocky Oyakhire Edoh, Business Analyst.
The Call Volume Trend is a call centre metric that measures the total number of inbound and outbound call volumes hourly, weekly, or monthly and compares it with your Average Speed of Answer.
With this KPI, you can determine trends such as days with high demands. It sums up the calls handled by auto attendants and live agents.
The formula for CVT = total number of calls per period. The industry standard rate is 10 calls per hour.
Worried about a trend surge? Don’t worry.
Here’s how to prepare:
- Schedule your team and plan their time accordingly
- Use the best user-friendly IVR menu in the market for effective self-service
- Automate call distribution using TelebuHub’s powerful ACD
- Use the best call centre solutions software
- Offer a call-back service.
Call centre metrics best practices
All the 15 contact and call centre KPIs and metrics mentioned above are crucial to help you understand customer satisfaction levels and agent productivity.
Now, here are 5 call centre metrics and KPI best practices to improve call centre KPIs and metrics:
- Set clear goals: Just like a treasure map, establish specific metrics that align with your objectives so your team knows where they’re headed and can conquer challenges like a band of pirates hunting for gold.
- Monitor real-time data: Keep a vigilant eye on your call centre’s real-time metrics like call volume and wait times so you can swoop in and address any issues before they escalate like a superhero, saving the day (or at least your call centre’s reputation).
- Continuous training: Invest in training programs that nurture your agents’ skills, transforming them into customer service warriors who can slay even the trickiest of customer complaints with their impressive knowledge and charm.
- Embrace automation: Embrace the power of automation to streamline mundane tasks and let your agents focus on what they do best – providing top-notch service while reducing the risk of repetitive task-induced insanity.
- Foster team collaboration: Encourage teamwork and camaraderie among your agents, creating an environment where they can support each other and share knowledge, like a group of synchronised swimmers performing a flawless routine.
- Regular performance feedback: Provide constructive feedback and recognition to your agents, ensuring they feel valued and motivated, just like receiving a standing ovation after an epic karaoke performance.
- Adapt and evolve: Stay agile and adapt to changing customer needs and industry trends, like a chameleon changing colours to blend into its surroundings, so your call centre remains relevant and ahead of the competition.
Remember, these best practices are like the ingredients to a secret recipe – combine them with your call centre’s unique flavour to create a practical customer service experience that leaves everyone with a smile.
TelebuHub helps you track your call centre metrics and measure performance
Now, you know the best call centre metrics and KPIs to track.
TelebuHub can help you track and measure your KPIs and improve productivity. Our cloud-based software allows you to manage your call centre from anywhere.
Schedule a demo to see how TelebuHub can help you today.


0 Comments